Red and gold fireworks burst against a cloudy blue night sky.

Fort Myers Real Estate Market Report: July 2025

Fort Myers Market Reports Mike McMurray - Top real estate agent SWFL

Real Estate Market Update – Fort Myers July 2025 Home Prices & Trends

MARKET SUMMARY

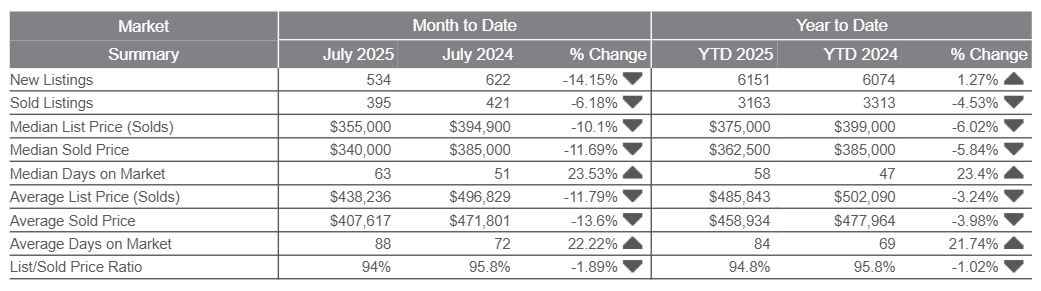
Fort Myers | July 2025 | ALL PROPERTY TYPES

Fort Myers real estate market table comparing July and year-to-date 2025 figures with 2024.

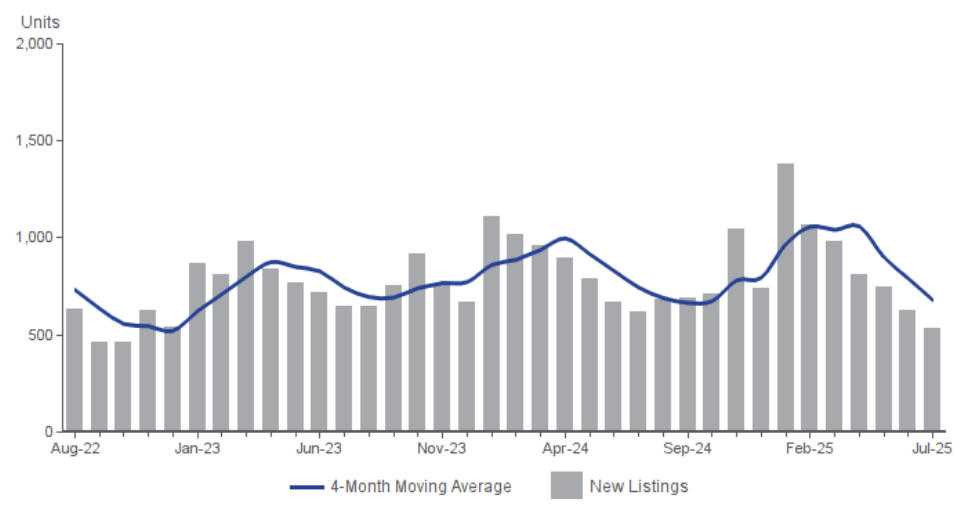
NEW PROPERTIES

Number of new properties listed for sale during the month

Chart of monthly new listings and four-month moving average, August 2022 to July 2025.

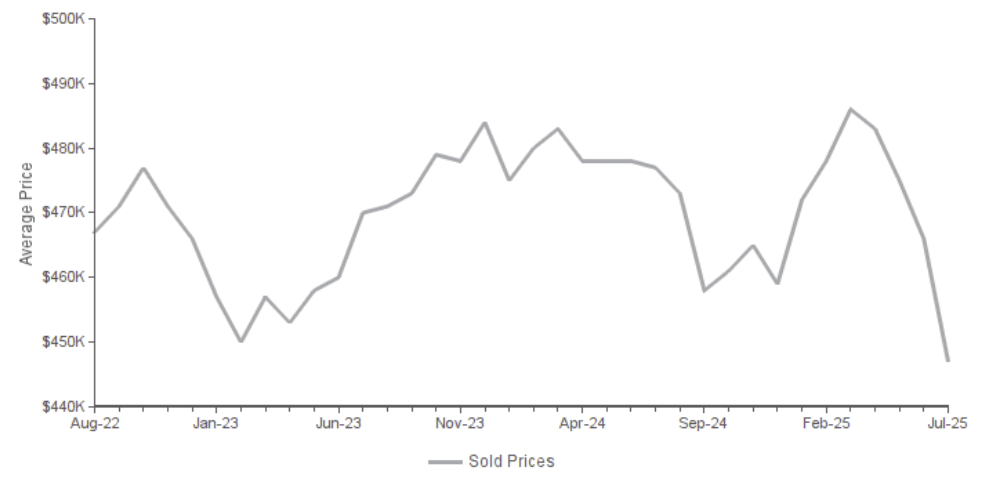
AVERAGE SALES PRICE

Average price for sold properties (6-Month Moving Average)

Line chart of Fort Myers sold prices, ending near $447,000 in July 2025 after a sharp decline.

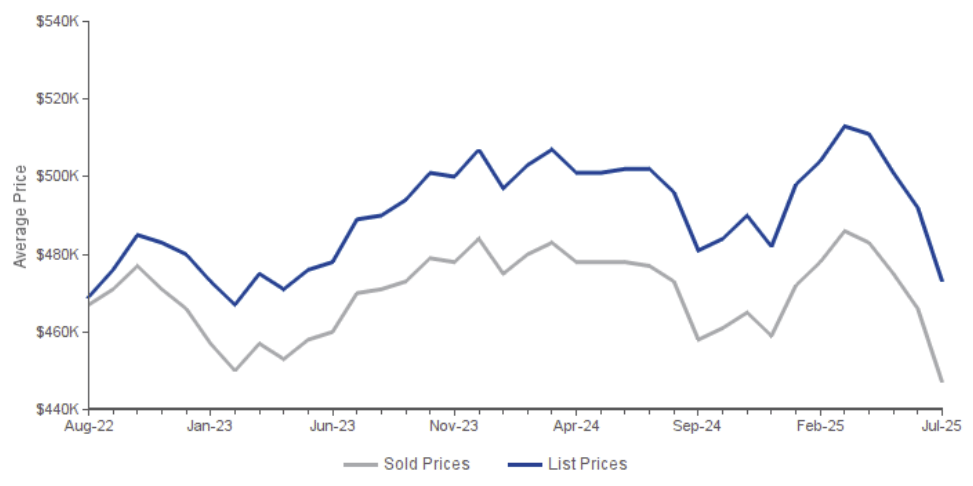
AVERAGE SALES/LIST PRICE

Average list price compared to average sold price of properties sold each month (6-Month Moving Average)

Fort Myers price chart: list and sold prices both decline by July 2025, with sold prices near $447K.

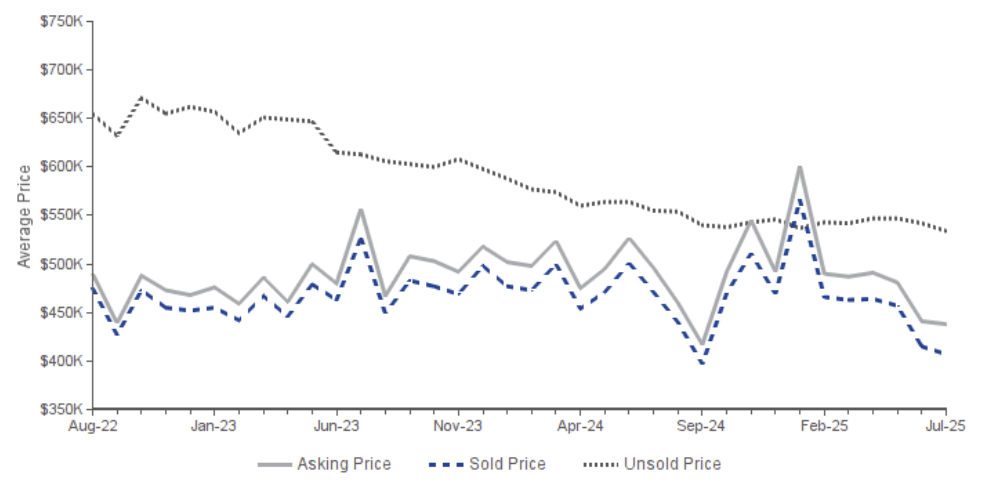
AVERAGE ASKING/SOLD/UNSOLD PRICE

Asking Price | the average asking price of sold properties
Sold Price | the average selling price
Unsold Price | the average active list price

Chart comparing Fort Myers asking, sold, and unsold prices from August 2022 to July 2025.

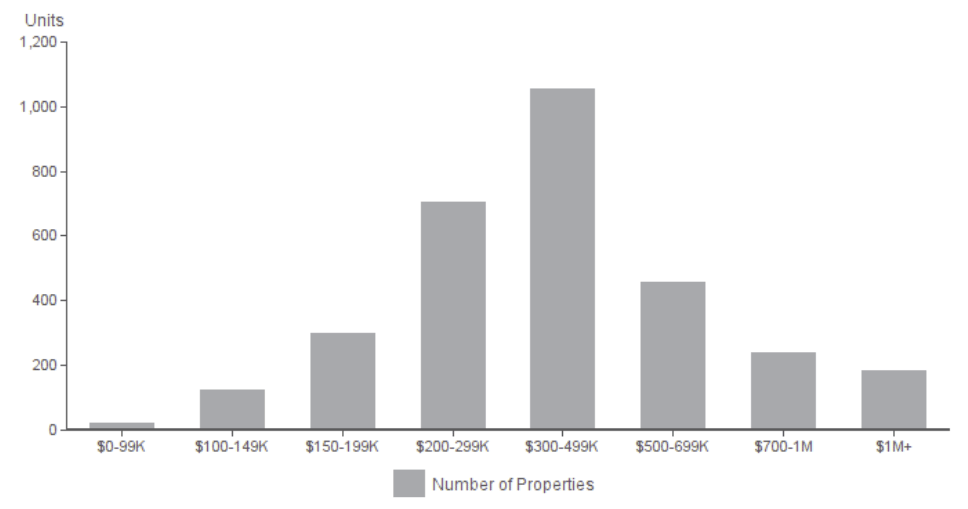
PROPERTIES FOR SALE

Number of properties currently listed for sale by price range

Bar chart of properties by price range, peaking at about 1,050 in the $300–499K range.

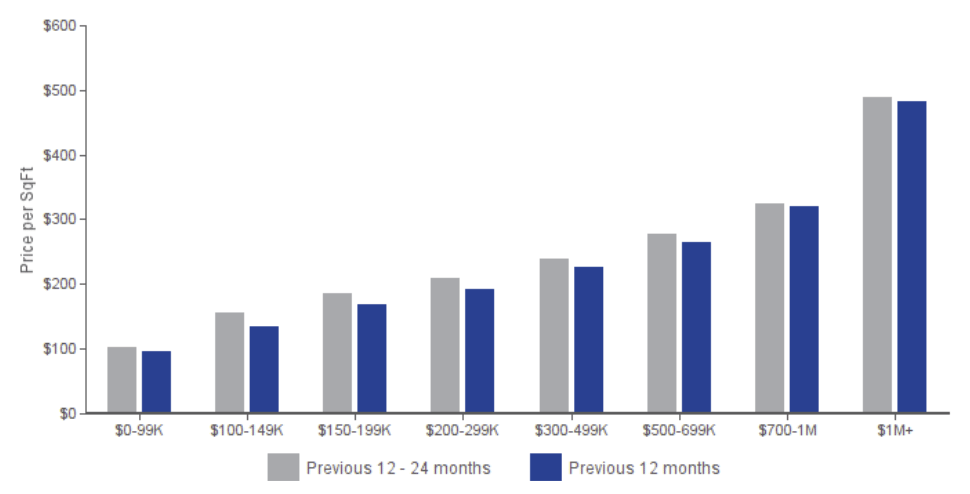
AVERAGE SALES PRICE PER SQFT

Average Sales Price per SqFt for previous two years

Bar chart compares price per square foot across eight home price ranges for two periods; earlier prices are higher in every range.

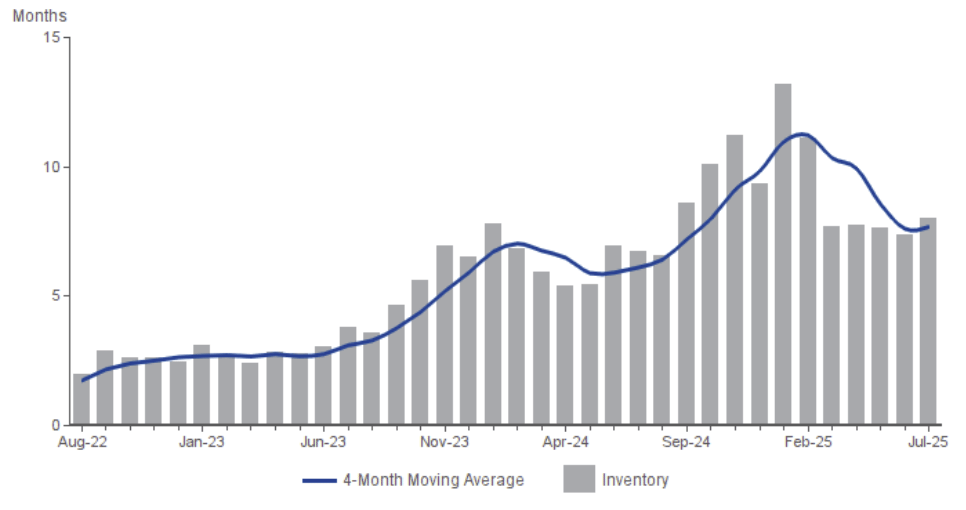
MONTHS SUPPLY OF INVENTORY

Properties for sale divided by number of properties sold

Fort Myers inventory chart, August 2022–July 2025, with inventory bars and a four-month moving average.

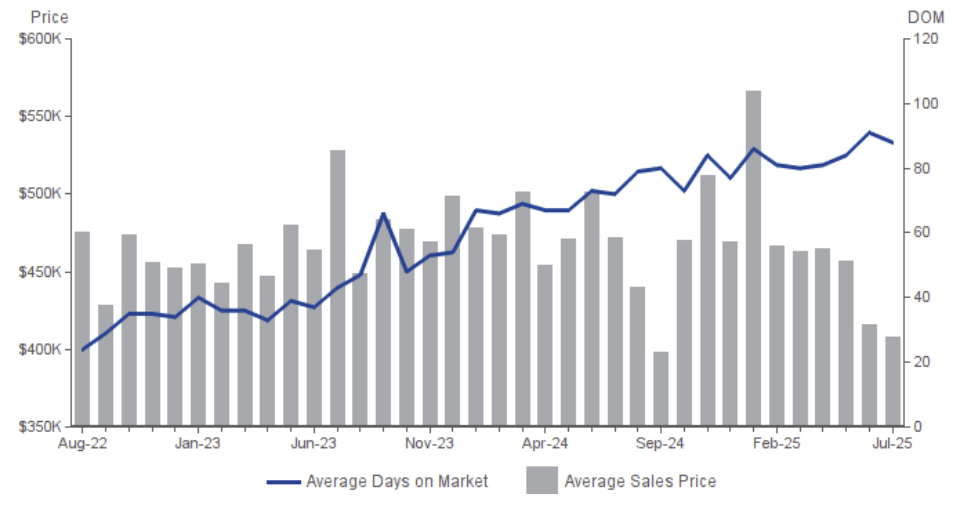
AVERAGE SALES PRICE AND AVERAGE DAYS ON MARKET

Average Sales Price | Average sales price for all properties sold.
Average Days on Market | Average days on market for all properties sold.

Fort Myers market chart: average sales prices and days on market, August 2022 to July 2025.

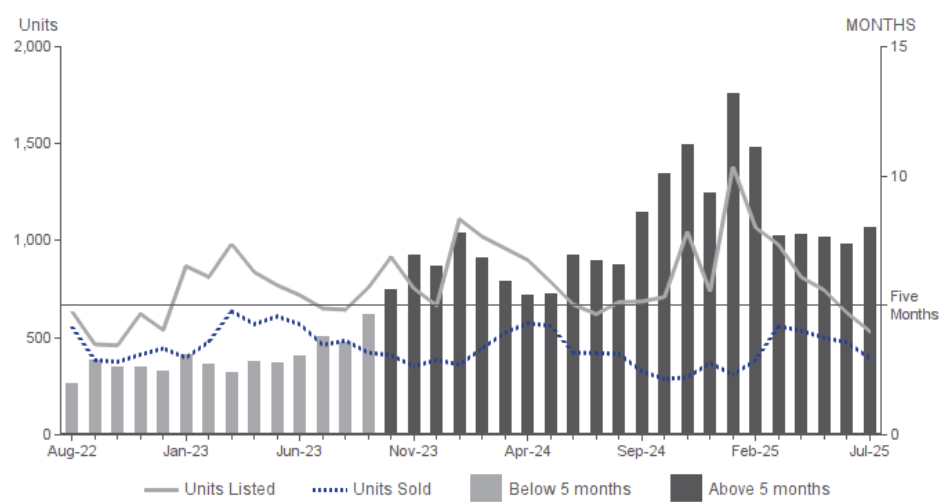
MONTHS SUPPLY OF INVENTORY

Months Supply of Inventory | Properties for sale divided by number of properties sold.
Units Listed | Number of properties listed for sale at the end of month.
Units Sold | Number of properties sold.

Fort Myers market chart showing units listed, units sold, and inventory above or below five months, August 2022–July 2025.

Thinking Real Estate

You will appreciate working with a team who is more like an extended family, one that takes care of each other and encourages success. Plus, we are backed by the strength of Royal Shell.
Follow Us On Instagram